
Long Term Growth May Slow In US Stock Markets Due To Overvalued Stocks
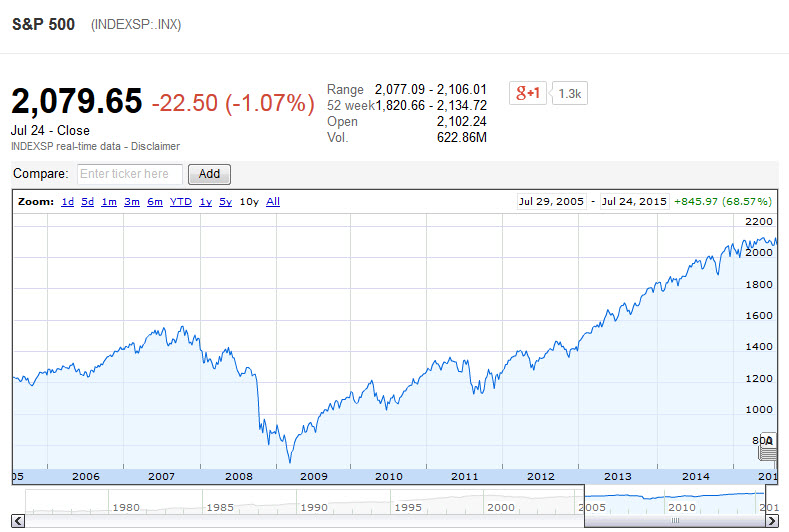
The price of the S&P 500 over the last 10 years.
Following the financial meltdown of 2008 investors have seen a six year boom in stocks with the S&P 500 rising up to 2,079 at the time of writing all the way up from its low of 683 in 2009 however according to Merrill Lynch this has left the U.S. stock market overvalued on 13 of 18 benchmark measures. This doesn’t indicated an impending market crash however does suggest long-term returns may be below-average for investors in US markets.
When analysing commonly used gauges to understand the value of a stock including last year’s and next year’s earnings, growth rates, operating cash flow, gold, net asset values and the overall size of the economy Merrill Lynch analysts found valuations to be above average historical levels.
In most of the measures the degree of overvaluation was only slight although when strategists removed the extreme numbers of the 1990s dot-com bubble from the historical data, the results did look worse. An example of this is that from June 30th, the stock market traded at an average 17.4 times per-share earnings of the past 12 months in comparison to a historical average of 15.3 since 1960 (this excluded the tech bubble, it was 16 times when included). Stocks are also valued at 12.3 times annual operating cash flow, compared to 9.6 since 1986 (excluding the bubble).
Any individual measure used by analysts cannot be used solely to rate a stock as with any statistic they can be skewed to misrepresent a company if a broader understanding of a business including its assets, debts and growth potential aren’t taken into consideration. Some of the measures with the longest track records seem to look the worst. The cyclically adjusted price-to-earnings ratio, which is used to compare stocks to the average per-share earnings of the previous 10 years, has been tracked by Yale University finance professor Robert Shiller with data back to 1881. Using this data stocks have been identified as 61% above their long-term average.
Using Warren Buffett’s indicator which compares the value of the stock market with the size of U.S. gross domestic product, suggests stocks are overvalued by nearly 100%. It is hard to use this data these days as many big U.S. companies such as Paypal, Apple, Amazon and even soon to be listed Ferrari are so global that they cannot be compared solely with the U.S. economy.
From the research metrics which suggest stocks are still good value are merely relative measures such as those that say S&P stocks are cheap in relation to booming bonds or small-caps.
This type of analysis does point to the fact that the US stock markets long-term historical growth could be set to slow in future years unless prices are to take a slight correction at some point.